Waterford Early Learning: Introduction to School Dashboards
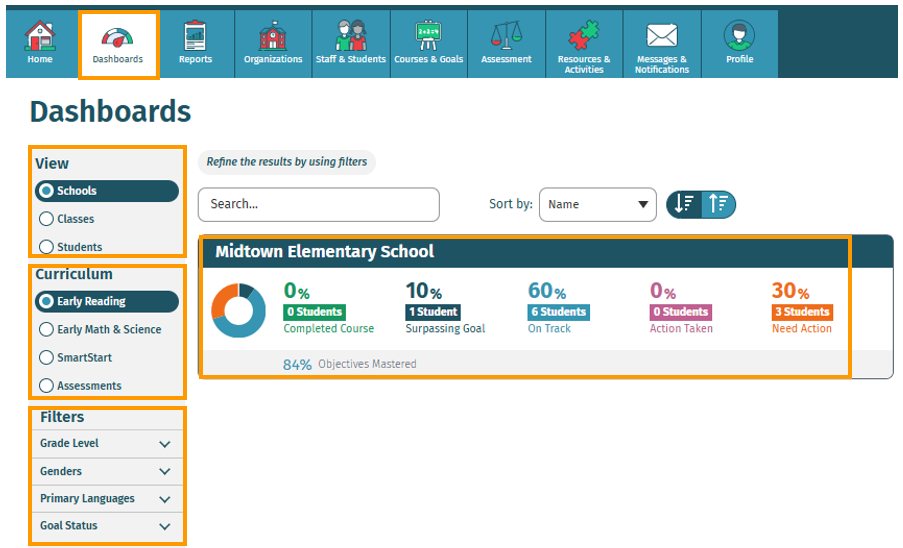
As a school administrator, you can view your school dashboard to get a quick overview of the status of students within the school(s) you are assigned to.
Here you will see a breakdown of students within the school using the following goal statuses:
- Completed Course (Green): Student has finished a course
- Surpassing Goal (Dark Blue): Student is projected to surpass their project goal by the end of the school term
- On Track (Blue): Student is projected to meet their project goal by the end of the school term
- Action Taken (Purple): Student is not currently projected to meet their goal, but an action plan has been taken by their teacher
- Needs Action (Orange): Student is not currently projected to meet their goal and has not been assigned an action plan by their teacher
The Objectives Mastered percentage represents the number of objectives that students within your school have mastered out of the total number of objectives they have seen. If, for example, students in your school have encountered 100 objectives and mastered 73 of them, the Objectives Mastered percentage will be 73%.
By selecting the School view, you will see the following courses available for selection as dashboard filters:
- Early Reading
- Early Math & Science
- SmartStart
- Assessments
Within the Reading, Math & Science and SmartStart courses, you can use the following filters:
- Grade Level
- Genders
- Primary Language
- Goal Status
As you apply filters, the dashboard will reload with updated values to reflect the students within your school who meet the applied filters.

Here’s a step-by-step walkthrough in video format.
Last Updated: 6/06/25
