Waterford Family: Dashboards
Waterford Family dashboards can be filtered by individual child and display the following information for your student:
- Weekly Usage
- Year-To-Date Usage
- Completion & Scores
- Course Completion
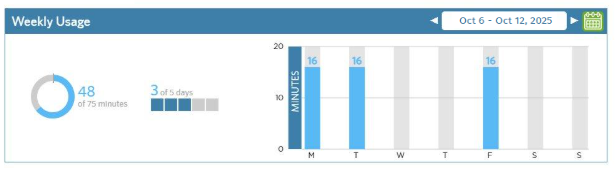
Weekly Usage
This section displays the following information about your student by week (updated every one to two hours):
- Minutes: the weekly number of minutes your student spent on Waterford
- Days: the number of days your student used Waterford this week
- Time: the weekly amount of time your student spent per day
The default display for Weekly Usage is the current week. You can select previous weeks by using the back and forward buttons next to the date. For a specific week, use the green calendar button to choose the desired time period.
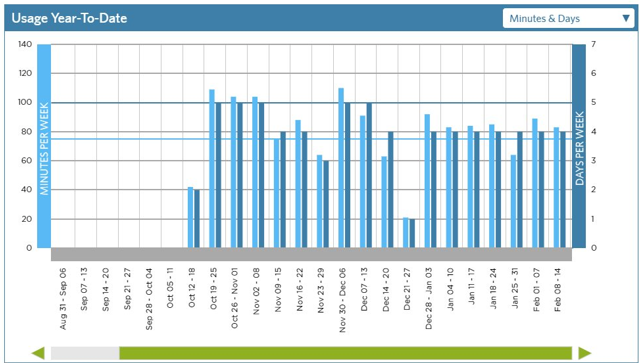
Usage Year-To-Date
This section displays a summary of the minutes and days your student used the program per week throughout the school year compared to their usage goals. The information in this section is updated nightly.
The bars display the actual usage while the bold horizontal lines mark their days goal or minute goal. You can change which goals you’re viewing with the dropdown menu on the title bar.
Completion & Scores
This section displays the learning strands for the program you’re viewing. The levels display across the top. The information in this section is updated nightly.
The individual boxes represent the student’s progress through each of the strands. You can hover over each strand segment to display more information.
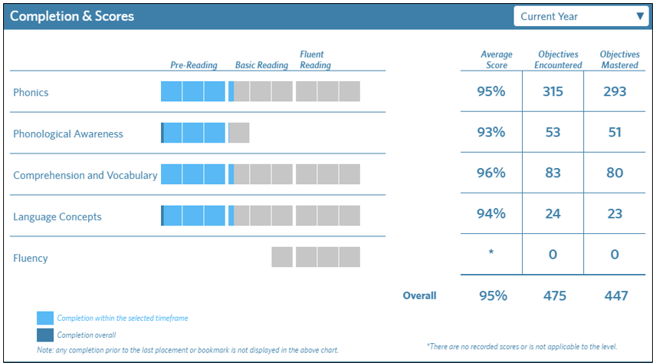
You can view the Completion & Scores information from the following time periods using the dropdown bar in the right-hand corner:
- Last Week
- Current Week
- Current Calendar Month
- Three Months
- Current Year
- Total Program
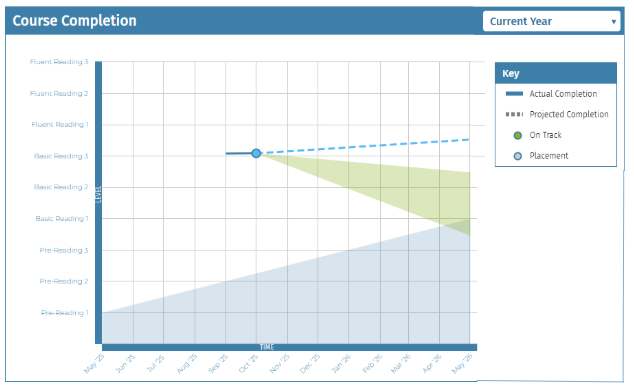
Course Completion
This section displays the level goal progress for the student based on their starting location. You can view either the Current Year or Total Progress. The information in this section is updated on Monday every two weeks.
You can view the following Course Completion information on a visual chart:
- Actual Completion: the student’s progress history towards their goal
- Projected Completion: the student’s projected progress towards their goal
- On Track: student is projected to reach their goal by the goal period
- Placement: student’s placement score at the beginning of the selected time period
Last Updated: 10/6/25