Waterford Early Learning: Introduction to Student Progress Graph Dashboards
As a teacher or administrator in Waterford Early Learning, you can view a detailed graph of individual student progress through the Dashboards tab.
To view this graph, select the Students view in the Dashboards tab. From there, you can select Progress Graph.
The Progress Graph displays the Level Goal progress for an individual student over time based on their starting location.
The x-axis (horizontal) shows the months in which the student will be using the program, and the y-axis (vertical) shows the ascending levels for the selected curriculum.
In this graph, you can view the following information:
- Starting Level: the curriculum level where the student began, denoted by a pink P button
- Current Level: the curriculum level where the student currently is, denoted by a blue dot
- Actual Completion: the student’s history of progress toward their goal, denoted by a solid blue line
- Projected Completion: the student’s projected progress toward their goal, denoted by a dotted line
Level Goal: the student’s academic goal for the selected time period, denoted by a green star
- On Track Zone: the range in which a student will still be considered on track for their set goal, displayed in blue shading
- Placement: the student’s placement score at the beginning of the selected time period
The green cone you see in the graph shows the regions in which the student should be at a given time in order to meet their end-of-year goal.
The Projected Completion is indicated by a dotted line that will turn one of the following colors depending on the student's current progress towards their goal.
- Orange indicates the student needs teacher action to get back on track. The dotted line will be shown below the green cone because the student is not currently where they need to be in order to meet their end-of-year goal.
- Purple indicates the student is catching up to where they need to be in order to meet their end-of-year target level. The dotted line will still be below the green cone, as they are not yet in the zone where they are projected to meet their end-of-year goal. The line will get closer to the green cone as the student continues to make progress.
- Green indicates the student is On Track to meet their end-of-year target level. The dotted line will be shown in the green cone, as the student is where we expect them to be to meet their end-of-year goal.
- Blue indicates the student is expected to surpass their end-of-year target level. The dotted line will be above the green cone, as they are above the baseline of where they need to be to meet their end-of-year target.
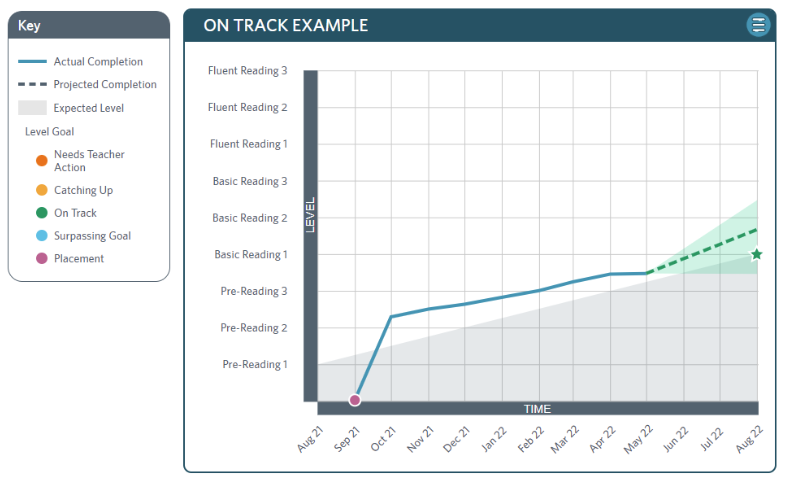
Below are three examples of a Progress Graph along with an interpretation of the data it displays.
This sample student placed in Pre-Reading 3 has an end-of-year level goal of Basic Reading 1. The student is On Track to meet their end-of-year goal, as indicated by the projected completion displaying as green inside the cone.
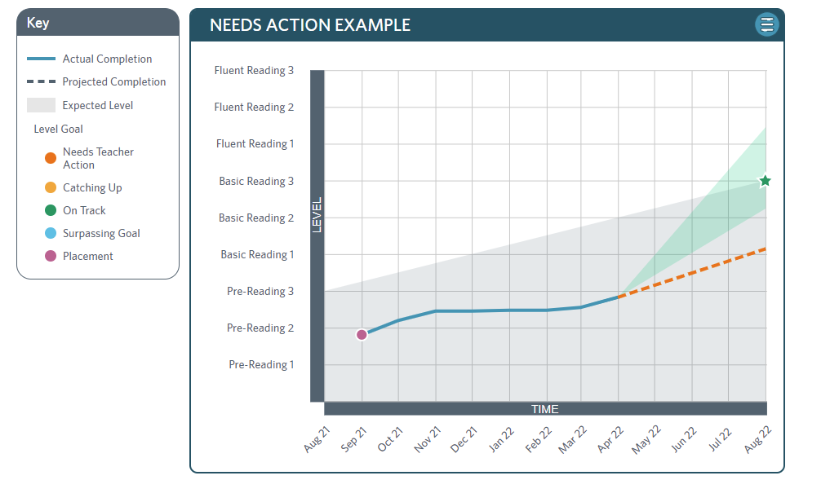
This sample student placed in Pre-Reading 2 and has an end-of-year level goal of Basic Reading 3. The student Needs Teacher Action to meet their end-of-year goal, as indicated by the projected completion displaying as the dotted line in orange, below the green cone
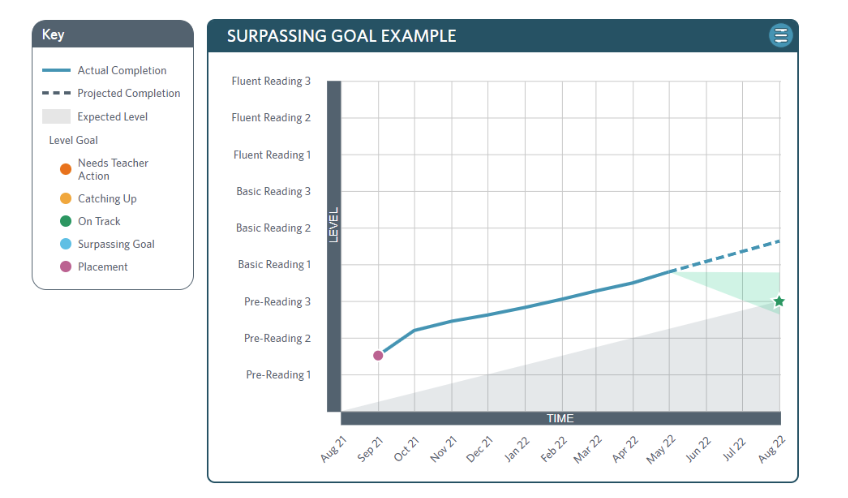
And finally, this sample student placed halfway through Pre-Reading 1 and has an end-of-year level goal of Pre Reading 3. The student is Surpassing Goal, as indicated by the projected completion showing in blue above the green cone.
As noted in the Waterford Refresh Rate Guidelines, the Progress Graph updates nightly.
Here’s a step-by-step walkthrough in video format.
Last Updated: 06/20/25